Understanding the RStudio Interface
Introduction to RStudio Interface
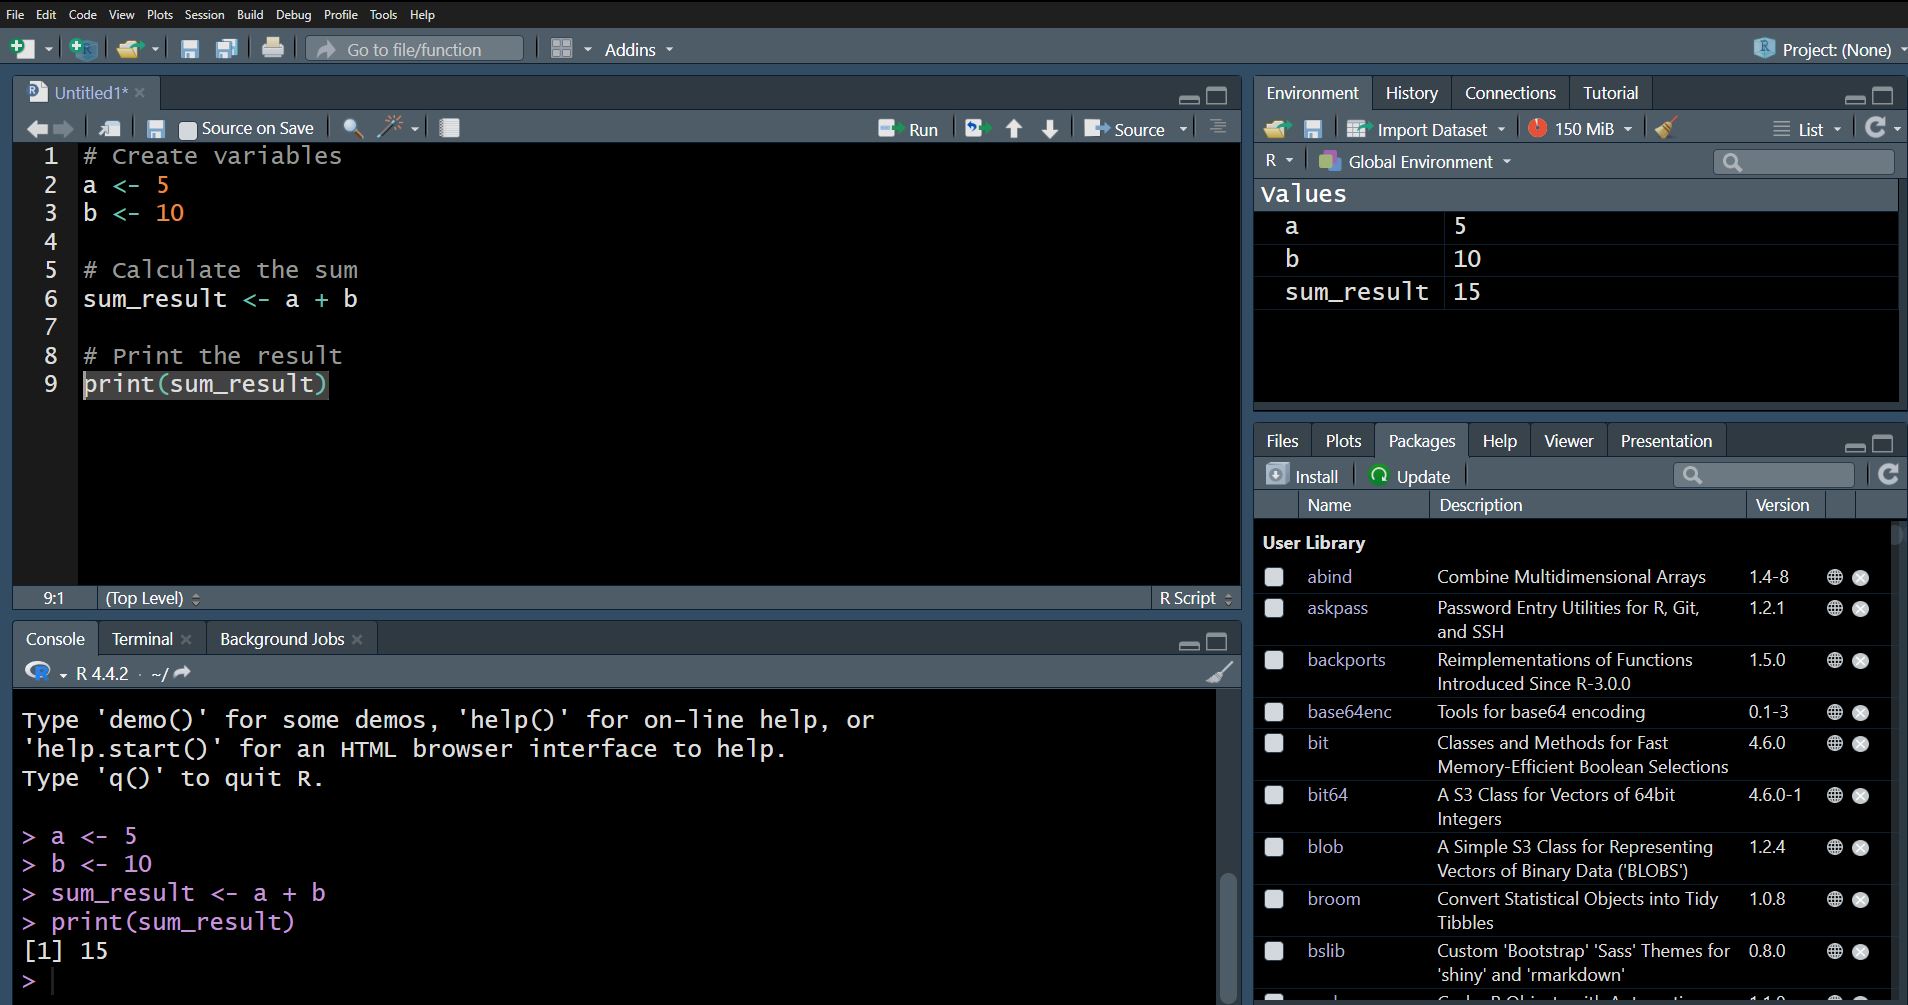
RStudio is an Integrated Development Environment (IDE) for R, designed to make your workflow more productive and organized. It provides a user-friendly interface with multiple panes, each serving a specific purpose. This guide will walk you through the key components of the RStudio interface: Console, Script, Environment, Plots, Packages, and Help.
RStudio Interface Overview
When you open RStudio, you’ll see four main panes:
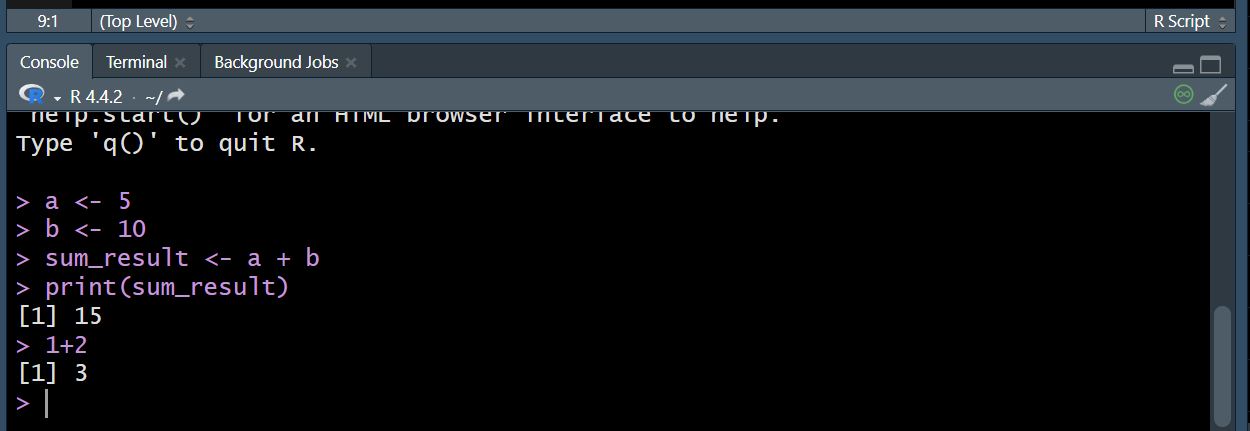
- Console: Where you can type and execute R commands directly.
- Script Editor: Where you write and save your R scripts.
- Environment/History: Displays the workspace variables, data, and command history.
- Plots/Help/Packages: Used for visualizations, documentation, and package management.
You can customize the layout of these panes by dragging and dropping them.
1. Console
The Console is where you can type R commands and see the output immediately. It is the heart of RStudio, allowing you to interact with R in real-time.
Key Features:
- Execute commands by pressing
Enter. - View output, warnings, and error messages.
- Access previous commands using the up/down arrow keys.
Example:
# Type a command in the Console
print("Hello, RStudio!")
2. Script Editor
The Script Editor allows you to write, edit, and save R scripts. Scripts are useful for writing longer pieces of code that you want to reuse or share.
Key Features:
- Write and save R scripts with a
.Rextension. - Run code line-by-line or in chunks using
Ctrl+Enter(Windows/Linux) orCmd+Enter(Mac). - Syntax highlighting and auto-completion for easier coding.
Example:
# Create a script in the Script Editor
x <- 10
y <- 20
z <- x + y
print(z)
3. Environment/History
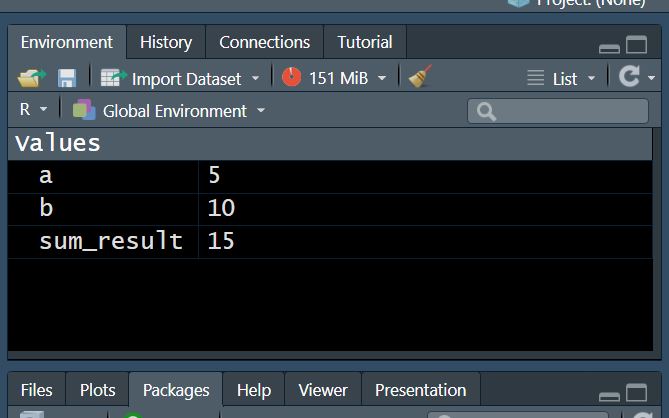
The Environment tab shows all the objects (variables, datasets, functions) currently loaded in your workspace. The History tab keeps a record of all the commands you've executed in the Console.
Key Features:
- View and manage workspace objects.
- Import and export datasets.
- Access your command history to reuse previous commands.
4. Plots

The Plots pane displays graphs and visualizations generated by R.
You can create a wide variety of plots using packages like ggplot2 and plot.
Key Features:
- View and export plots in various formats (PNG, PDF, etc.).
- Zoom in/out and navigate through multiple plots.
Example:
# Generate a plot
plot(1:10, type="l", col="blue", lwd=2, xlab="X-axis", ylab="Y-axis", main="Sample Line Plot")
5. Packages
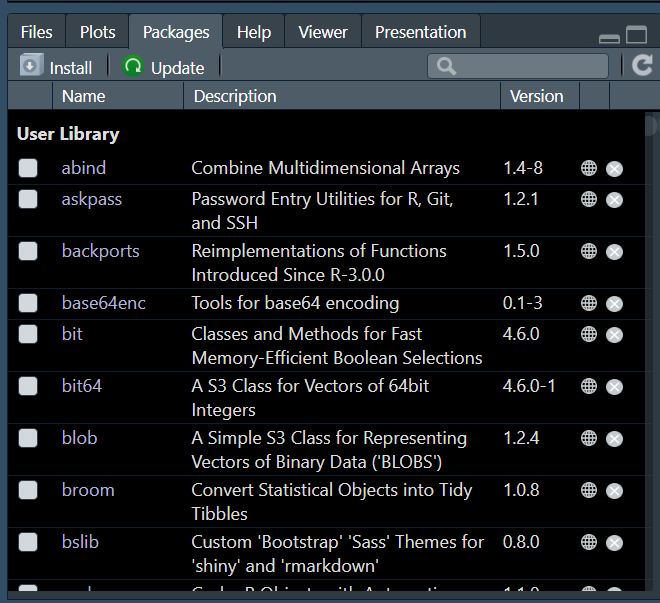
The Packages tab allows you to manage R packages. Packages extend the functionality of R by providing additional functions, datasets, and documentation.
Key Features:
- Install, update, and remove packages.
- View loaded and available packages.
Example:
# Install and load a package
install.packages("ggplot2")
library(ggplot2)
6. Help
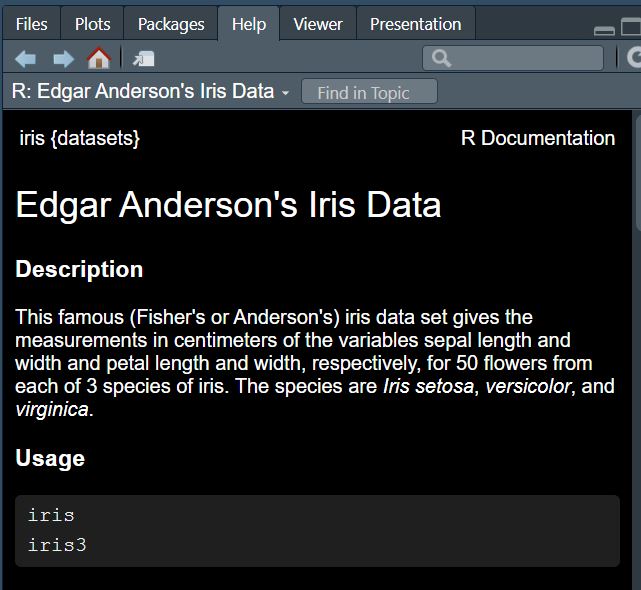
The Help tab provides access to R's extensive documentation. You can search for functions, packages, and other resources to get detailed information.
Key Features:
- Search for help on specific functions (e.g.,
?print). - Access package vignettes and manuals.
Example:
# Access help for the print function
?print
Practical Exercise
Try the following steps to familiarize yourself with the RStudio interface:
- Open RStudio and locate the Console.
- Type
print("Hello, RStudio!")in the Console and pressEnter. - Create a new script in the Script Editor and write the following code:
# Create variables a <- 5 b <- 10 # Calculate the sum sum_result <- a + b # Print the result print(sum_result) - Run the script line-by-line using
Ctrl+Enter(Windows/Linux) orCmd+Enter(Mac). - Check the Environment tab to see the created variables.
- Generate a plot using the code provided in the Plots section.
- Install the
ggplot2package and explore its documentation in the Help tab.